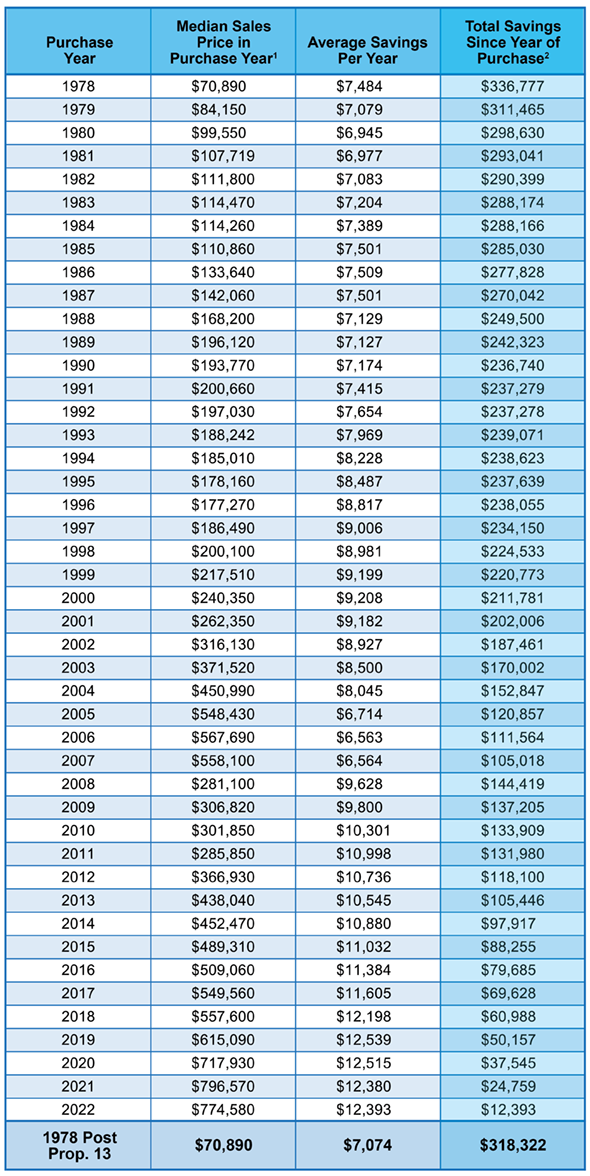
You can estimate your Proposition 13 tax savings with the chart below. The savings shown are based on the median sales price for homes in California for each year listed. (Every property is different and these should be considered only rough estimates.) If you bought your home for more than the statewide average, your tax savings — thanks to Proposition 13 and HJTA — are even greater. If you paid less, your savings will still be substantial.

Prop. 13 Savings Chart through 2022, prepared 2023
- Source: California Association of REALTORS®.
- Tax savings calculation compares the estimated tax paid under Proposition 13 with the tax that would have been paid if Prop. 13 had not been enacted. The tax rate in place when Proposition 13 passed was an average of 2.6%. (In some counties, the rate was much higher.)

